PTP Log Interpretation
PTP Log Interpretation
rms 16 max 33 freq -993 +/- 21 delay 510 +/- 0
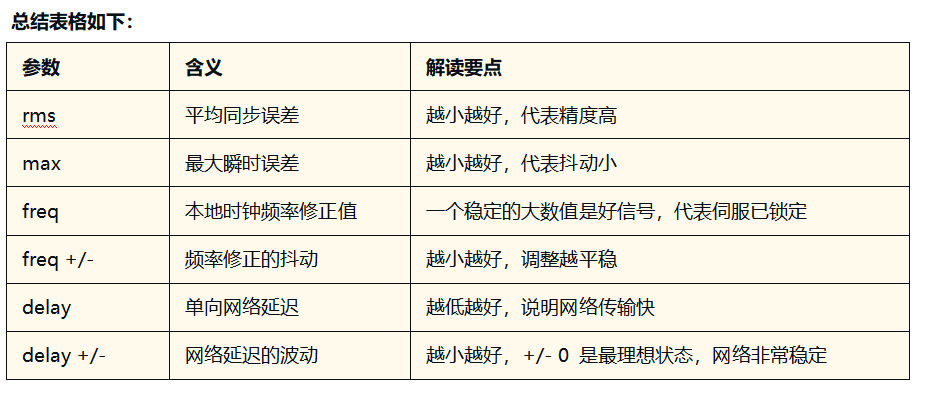
1. rms 16
Indicates the "average synchronization error" in nanoseconds (ns).
This value reflects the overall level of stability of the time offset between the device and the master clock. rms 16 means that the average deviation is only 16ns, which is already very small and falls within the range of high-precision synchronization. The smaller the value, the more accurate the synchronization.
2,max 33
Indicates "maximum instantaneous deviation", again in nanoseconds.
Over the entire statistical period, the maximum error is 33ns, which reflects the deviation of the "worst moment". max and rms values are not very different, indicating that the overall stability is very good and there is no drastic jitter.
3. freq -993 +/- 21
This indicates how well the PTP protocol corrects the local crystal frequency in parts per billion (PPB).
-993 Indicates that the device's local clock is slightly faster and the PTP is "slowing down" the calibration. This offset value is stable, indicating that the servo has a good grasp of the crystal characteristics.
+/- 21 indicates the range of fluctuation of the correction value, i.e., the frequency jitter is very small and the servo state is smooth and healthy.
4. delay 510 +/- 0
delay is the one-way network delay in nanoseconds transmitted from the master clock to the device.
510 indicates that the average latency is about 0.51 microseconds, which is very fast and indicates excellent network conditions.
+/- 0 Indicates that the network latency did not fluctuate during this time and the data was very consistent. In this case, PTP synchronization works best.
5. On the meaning of +/-
The +/- value after each parameter represents the range of fluctuations (i.e., the "standard deviation"), reflecting the stability of the system.
- the smaller the better
- A value of 0 is ideal, indicating that there is no jitter or fluctuation, which means that the network path and device state are very stable.